Fueled by a high number of mobile readers, scrollytelling is quickly replacing interactive graphics as a preferred method for telling complex data stories. Even though larger news outlets have used it for some time, few best practices have emerged and we are all still experimenting. In this article we therfore share four mistakes we've made in our first scroller and what we've learned from them.
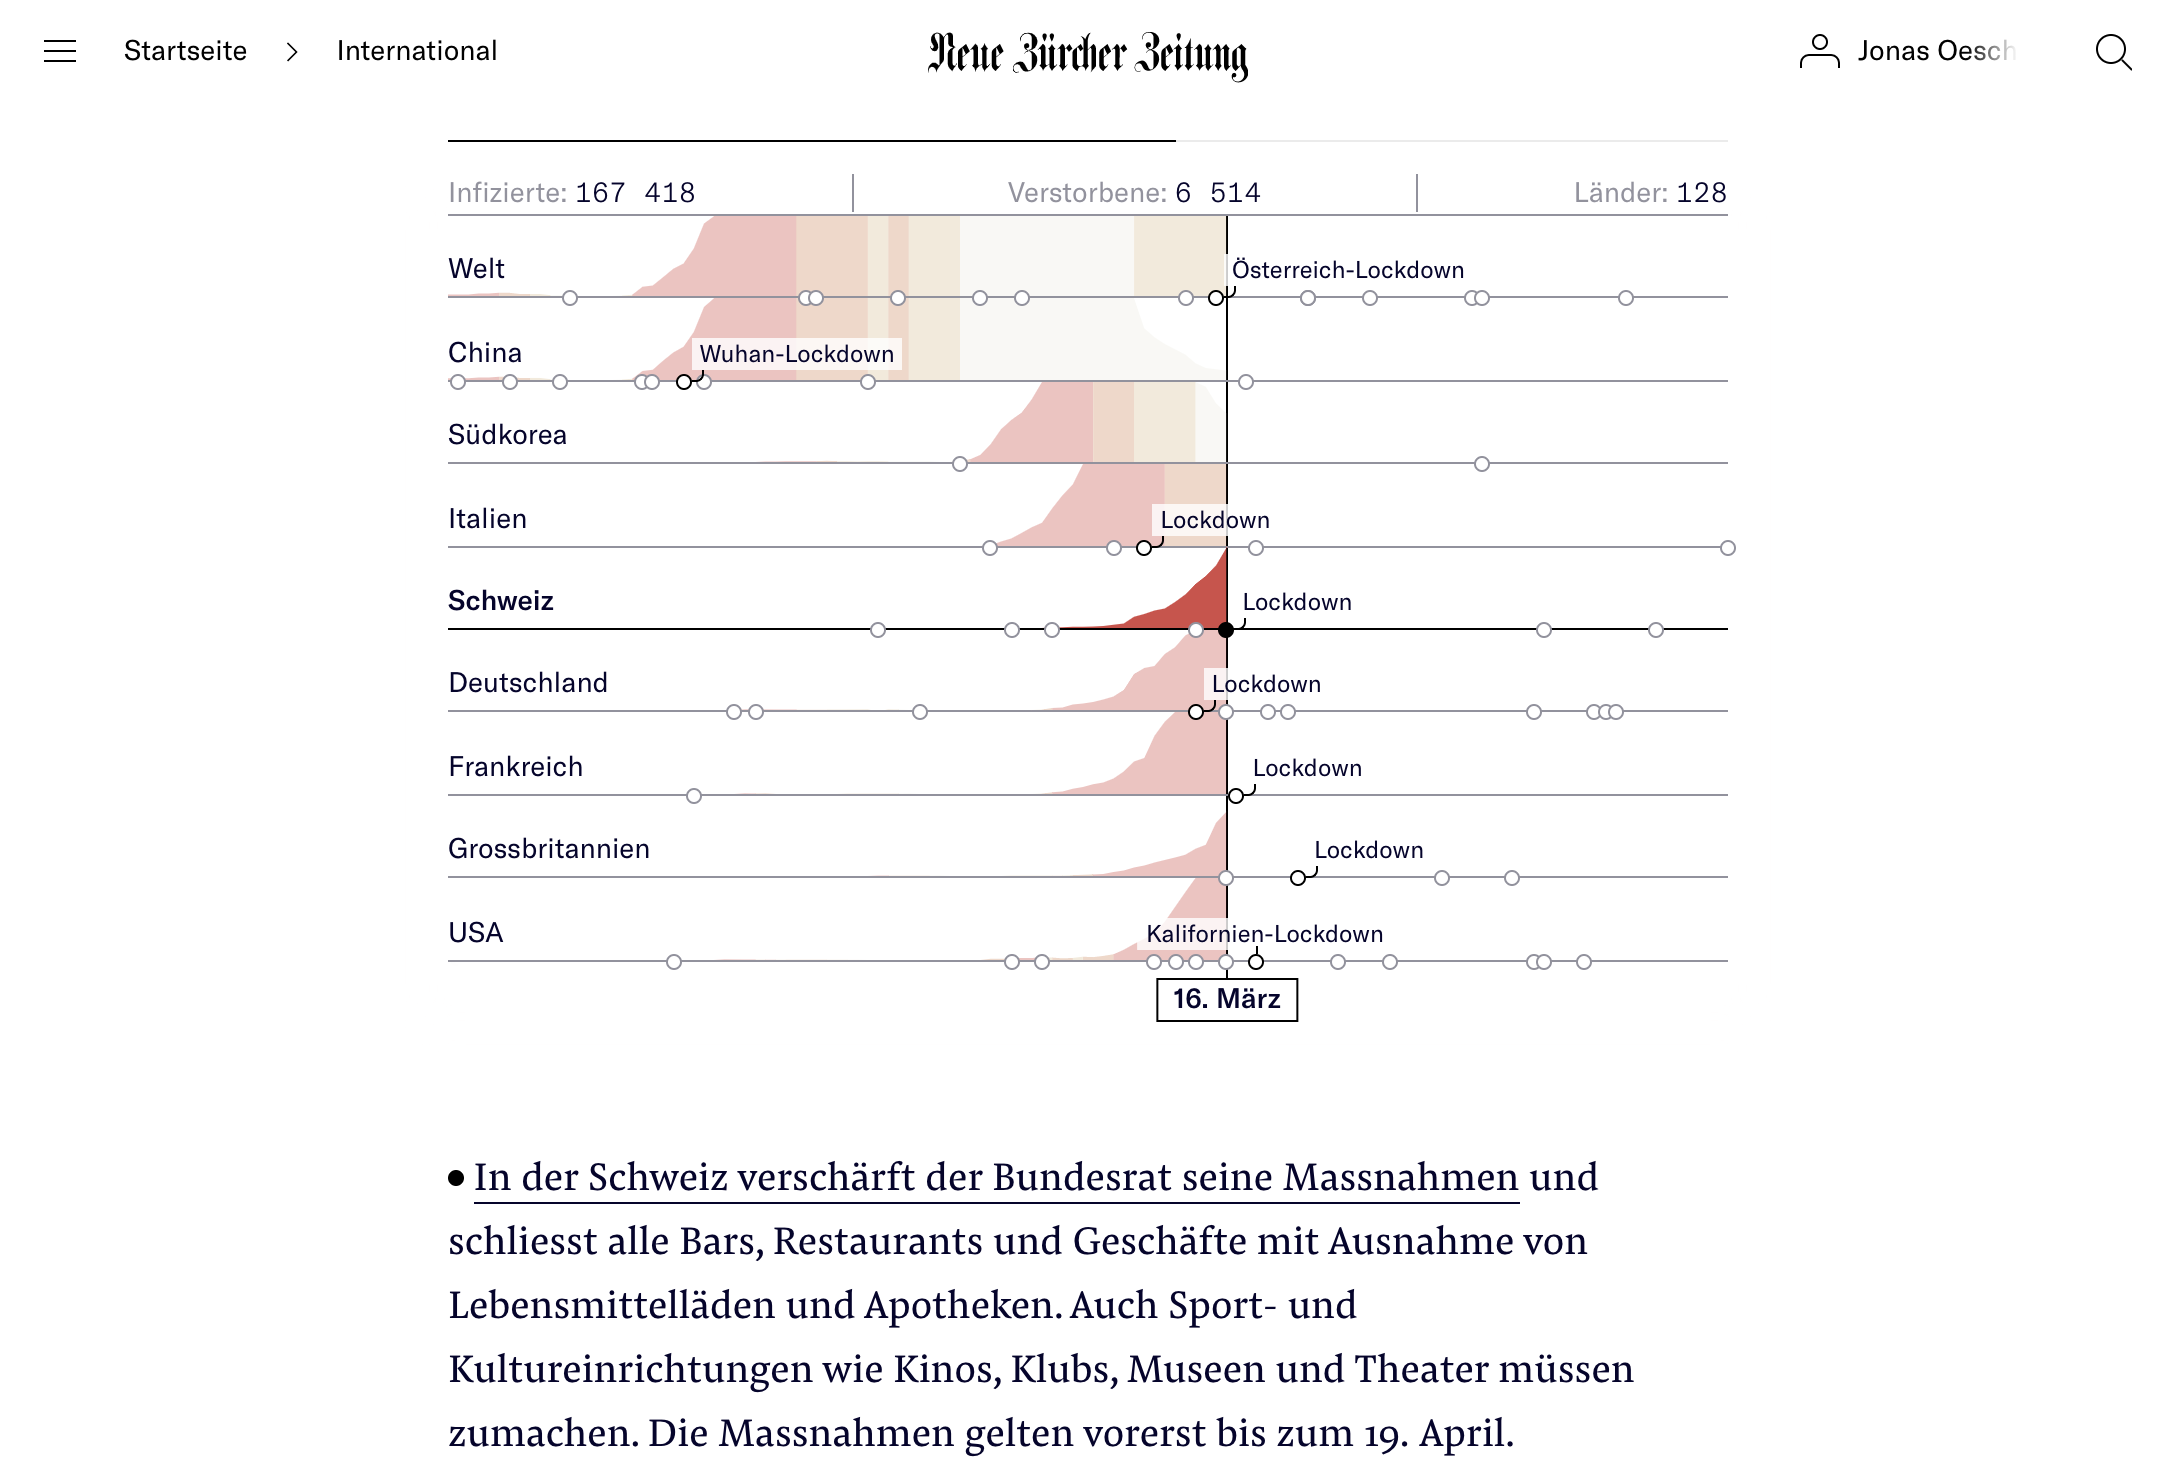
Screenshot of the published article on NZZ.ch
As Switzerland reopened from the Corona-Lockdown, we produced a retrospective of the events surrounding the Covid-19 outbreak around the world. The article was inspired by a similar piece in the Guardian.
The article was produced over a period of three weeks in a team of developers, journalists and designers. After the publication, we did informal user tests and looked at the screen recordings of some random readers. The process and the observations of our readers led to four insights:
- Prepare readers for what is coming
- You can't design it without using it
- Text and visualization need to tell the same thing
- Scroll-over seems to work better than scroll-under
Prepare readers for what is coming
It was painful to watch how many of the readers struggled to understand how the scroller worked at first. Some of them easily took ten seconds to figure out the mechanism. Even though we wrote that the story was «interactive», readers struggled to understand in what way and clicked on the graphic, excepting something to happen. After that, some of the tried to scroll sidewards (presumably to move through time, as time was shown on the x-axis). Many only discovered by accident, that they needed to scroll down.
Our resolution for the next time is therefore to better prepare our readers for what is coming. This could be an animated preview of the article, as recommended by Boy et al. or a simple «scroll down» hint at the beginning of the scroller.
You can't design it without using it
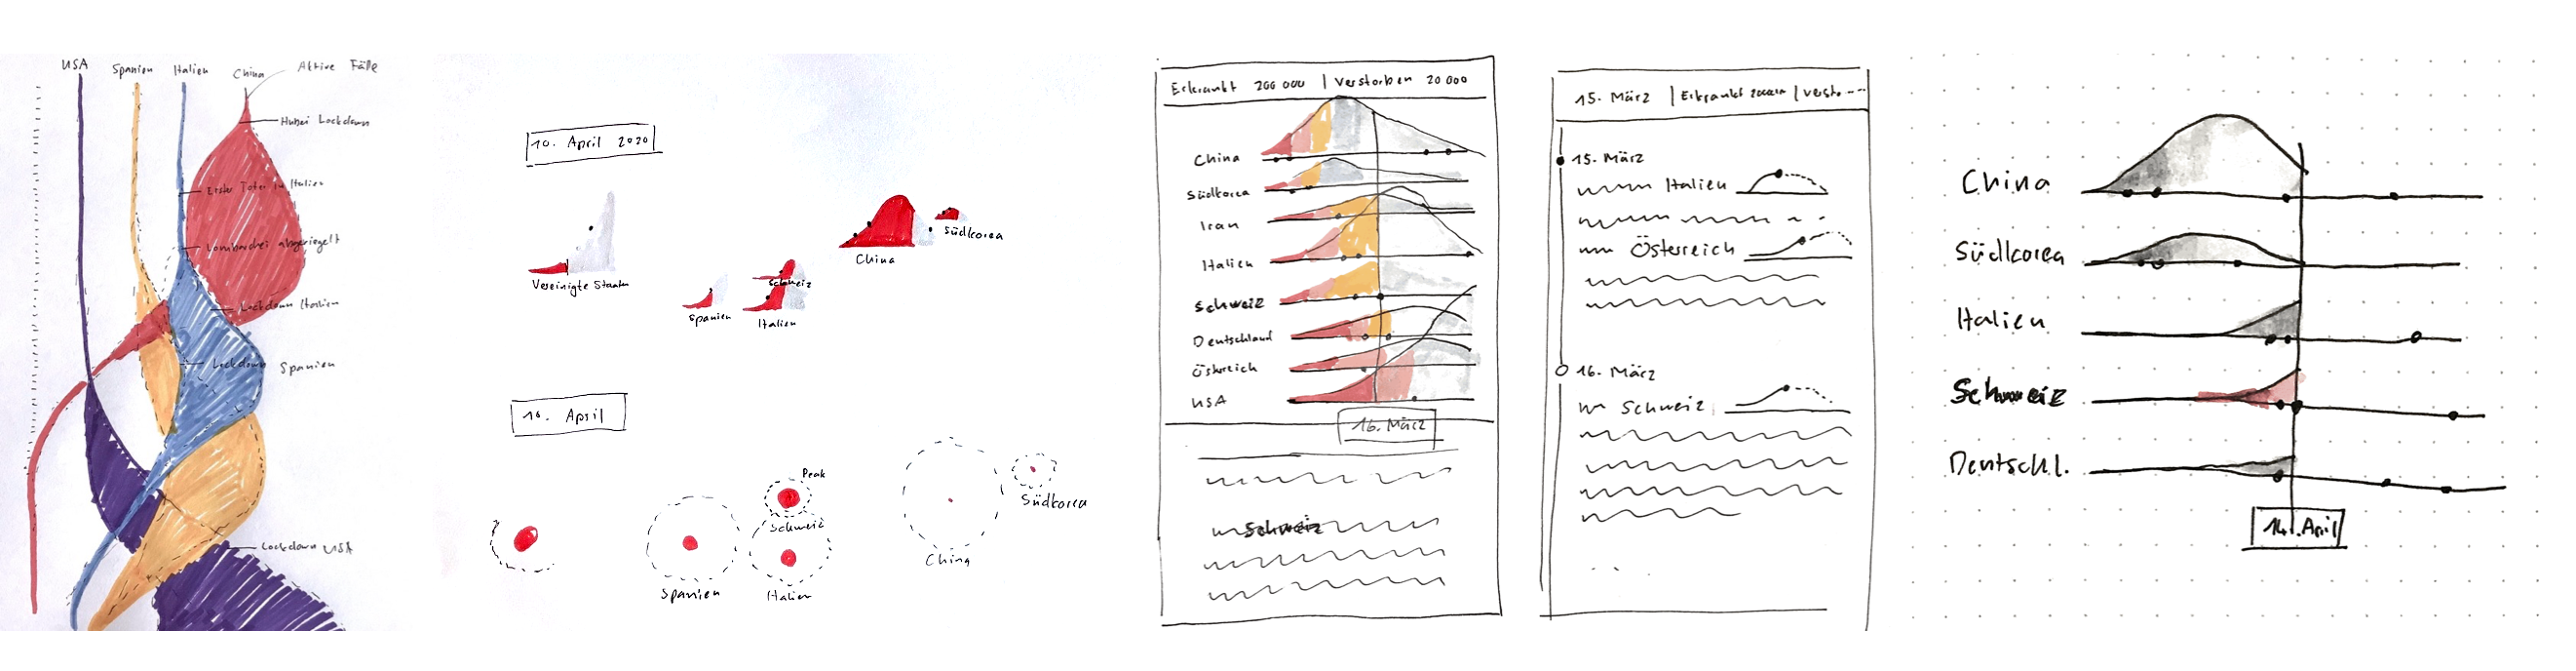
As the developers immediately started to build a skeleton for the scroller, I started to design by plotting the data and sketching a lot of screens. It is well known among visualization designers, that if you start designing without the data, your design will most likely not work in the end. The same goes for interaction, when you design it without using it.

When we looked the first interactive prototype after a week of static prototyping we where sobered. The article didn't work at all. Highlighted points didn't capture the attention enough, the rising curves where only visible after the most important measures had already happened (e. g. a lockdown or financial aid), making you wonder why they were implemented in the first place. But worst of all, there was practically no relationship between the text and the visualization except a common date.
Our resolution for next time is therefore to implement an interactive version as early as possible. So all project members (design, content, development) can try it out, learn and iterate on their part of the article.
We finally managed to address all of the points mentioned above. Most importantly, we've strengthened the connection between the text and the visualization with two small changes: we've added text labels that indicated when related events happened in other countries to the visualization. And we mention some of the numbers displayed in the visualization at important points in the text.
This already introduces the next insight: text and visualization need to be in sync.
Text and visualization need to show and tell the same thing

While observing readers we found that most of them first focused on the text and used the visualization for context. This is in line with what eye tracking experiments found: text labels are read before the graphics.
The visualization often showed interesting additional information, for example the related events, that was not mentioned in the text. With this, we effectively forced our readers to follow two storylines at once. Some of the mentioned that either, this felt mentally straining or that they feared they had missed something important.
Our resolution for the next time is therefore to not show anything important or interesting in the visualization that is not addressed in the text.
Scroll-over seems to work better than scroll-under
We put a lot of effort into keeping the texts short and the visualization small so that both of them could fit on one screen without covering each other. On scroll, the text would vanish behind the visualization on top. We imagined that this would be a superior approach to what is often used: text blocks that scroll over the visualization and cover parts of it. But after seeing how people use the article, we wouldn't do it the same way again. The readers had to constantly shift their attention back and forth between the visualization and the text to not miss anything important.
Our resolution for the next time is therefore to make the texts scroll over the visualization and give the readers time to look at the graphics, in the gap, while they scroll to the next text.
Even though, the article worked well with our readers and was shared and praised in general, we hope that our next scroller will vastly improve on the first by adhering to these four resolutions.
Thanks go to Manuel Roth, Barnaby Skinner, Ulrich Schwerin, Philip Küng, Nikolai Thelitz, and Kaspar Manz for the great collaboration.